Learn about Earth's Ice Coverage with Mixed Reality
How Merge EDU Can Enhance your Science Classroom with Real-time and Historical Satellite and Sensor Data
If you're looking for new ways to help your students understand ice coverage around the globe, Merge EDU can help!
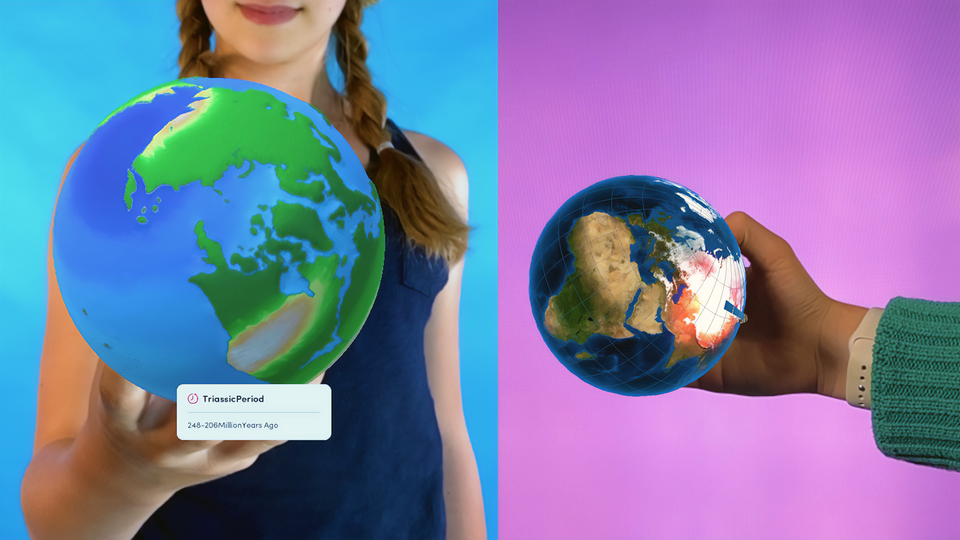
The Merge HoloGlobe app brings actual, real-time and historical NOAA and NASA satellite and sensor data and simulations to the Merge Cube, providing stunning views of the Earth and its many processes and systems into the palm of your hand. HoloGlobe is a hands-on resource for K-12 students, educators, and citizen scientists who want to learn more about Earth using real data.
Ice Coverage Around the Globe
It can be difficult for students to imagine how the ice caps at the North and South Poles can melt and form again over the course of a year (depending on the month and season). But with Merge EDU, they don't have to imagine - they can hold it in their hands!

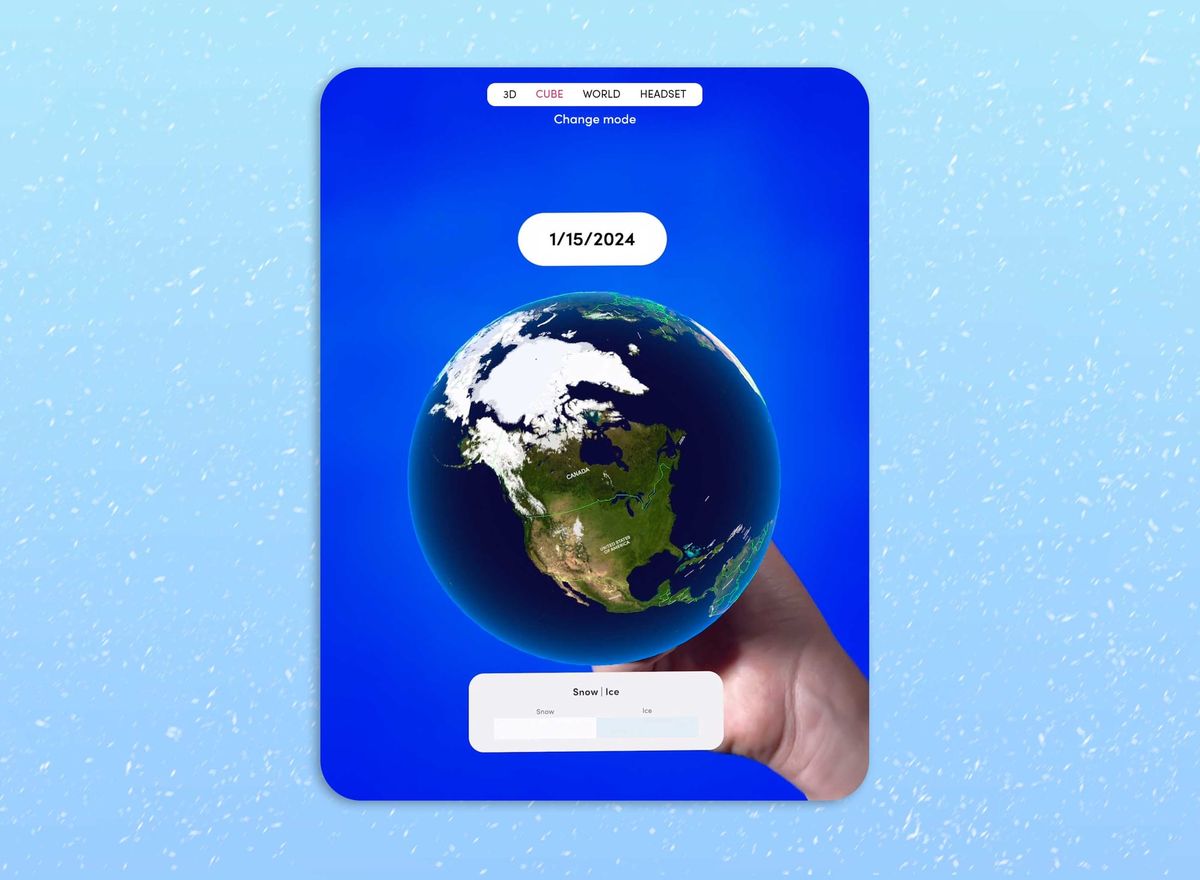
With the Ice Activity in the Merge HoloGlobe app, students can actually hold a model of the Earth with a focus on the poles showing ice real-time ice coverage, as well as an ice timelapse showing the changes in ice coverage throughout the past year.

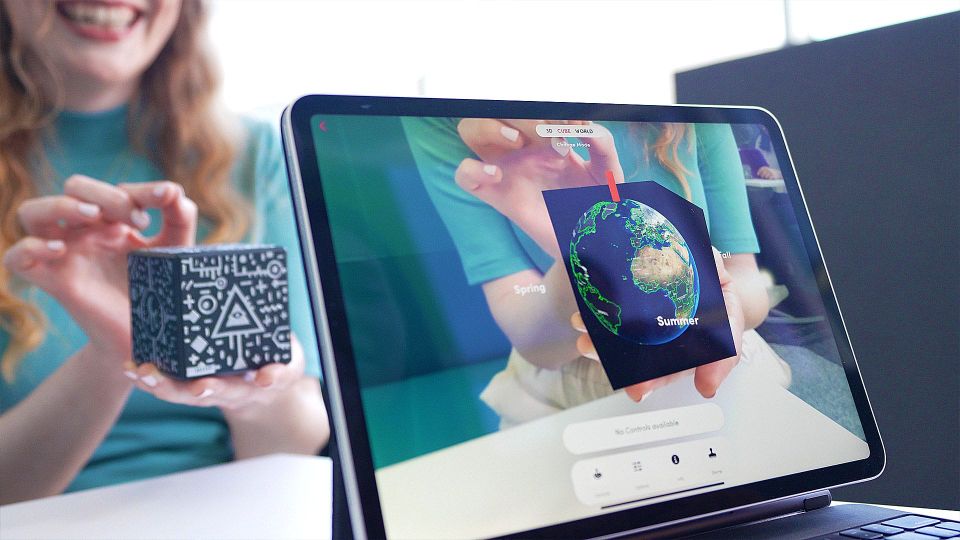
In the Northern Hemisphere, students can see that in the warm spring and summer months (April - September), the Earth's ice melts significantly, but in the fall months (October - February), ice begins to form again and cover more of the Northern Hemisphere.
At the same time, students can see the opposite is true in the on the Southern Hemisphere: spring and summer months here are September - February, so this is why less of the South Pole and surrounding areas covered in ice, and more of the South Pole ice covered in ice in April - September!

When it comes to explaining the science behind seasonal changes and the impact on our planet's ice coverage, real-time data is an invaluable asset! Students can see first-hand the variations as they happen, giving them a deeper understanding and fostering genuine interest. As they rotate the Merge Cube, they're encouraged to question, explore, and deduce the reasons behind these changes. This kind of interactive teaching not only facilitates active learning, but it also fosters curiosity, critical thinking, and engagement in students, arming them with skills needed for future success.