
From Our Streets to the Stratosphere: Exploring Ice and Snow with Merge HoloGlobe
Historic weather events don’t have to stay in the past once the ice melts. With Merge HoloGlobe, they become entry points for inquiry, data analysis, and systems thinking. Students learn not just what happened—but why it matters.
This January’s historic ice and snow storm didn’t just disrupt travel and close schools—it sparked questions. Why did this storm hit so hard? How common is this kind of weather? And how does what we experienced locally connect to what’s happening across the planet?
With Merge HoloGlobe and the Merge Cube, educators can turn a recent weather event students lived through into a powerful Earth science investigation. Instead of treating the storm as a one-off headline, students explore it as part of larger seasonal and climate systems shaping ice and snow around the world
Seeing Ice from Space
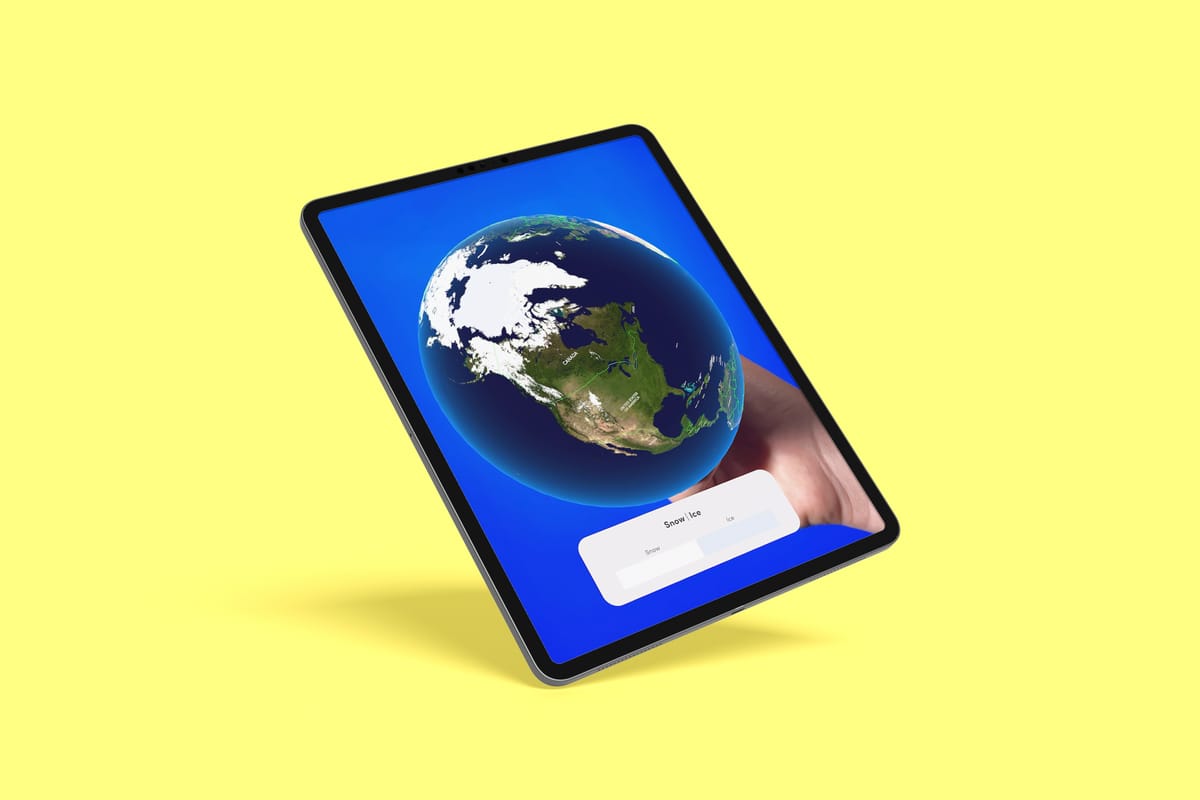
Using satellite imagery visualized through Merge HoloGlobe, students can explore global snow and ice cover in real time. What they experienced on the ground—icy roads, frozen trees, snow accumulation—becomes part of a much bigger picture.
The Ice visualization shows where snow and ice currently cover the Earth, revealing patterns that change with the seasons. Students quickly notice that winter storms leave visible signatures from space, especially across the Northern Hemisphere. This reinforces a key idea in Earth science: local weather events are connected to global systems.
Realtime Ice Data: What’s Happening Right Now?
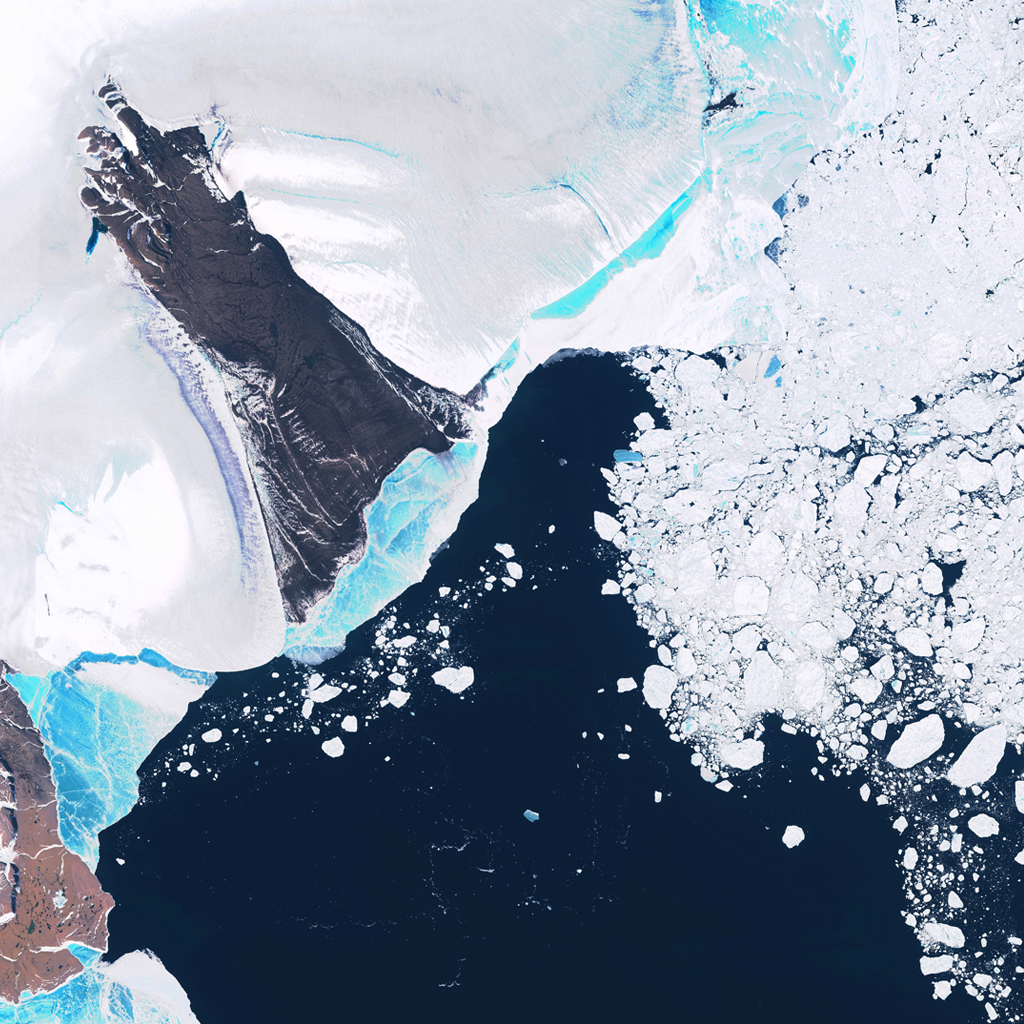
With the Realtime Ice Data activity, students examine up-to-date satellite data showing current ice and snow extent. Teachers can guide students to compare their region to others across the globe:
- Where is ice coverage expanding right now?
- Which regions are experiencing peak winter conditions?
- How does ice coverage differ between land and polar regions?
This activity helps students understand how scientists monitor Earth continuously—not just after major storms, but every day. It also introduces students to the role satellites play in weather forecasting, climate research, and environmental monitoring.
Ice Data Timelapse: Watching Seasons Move
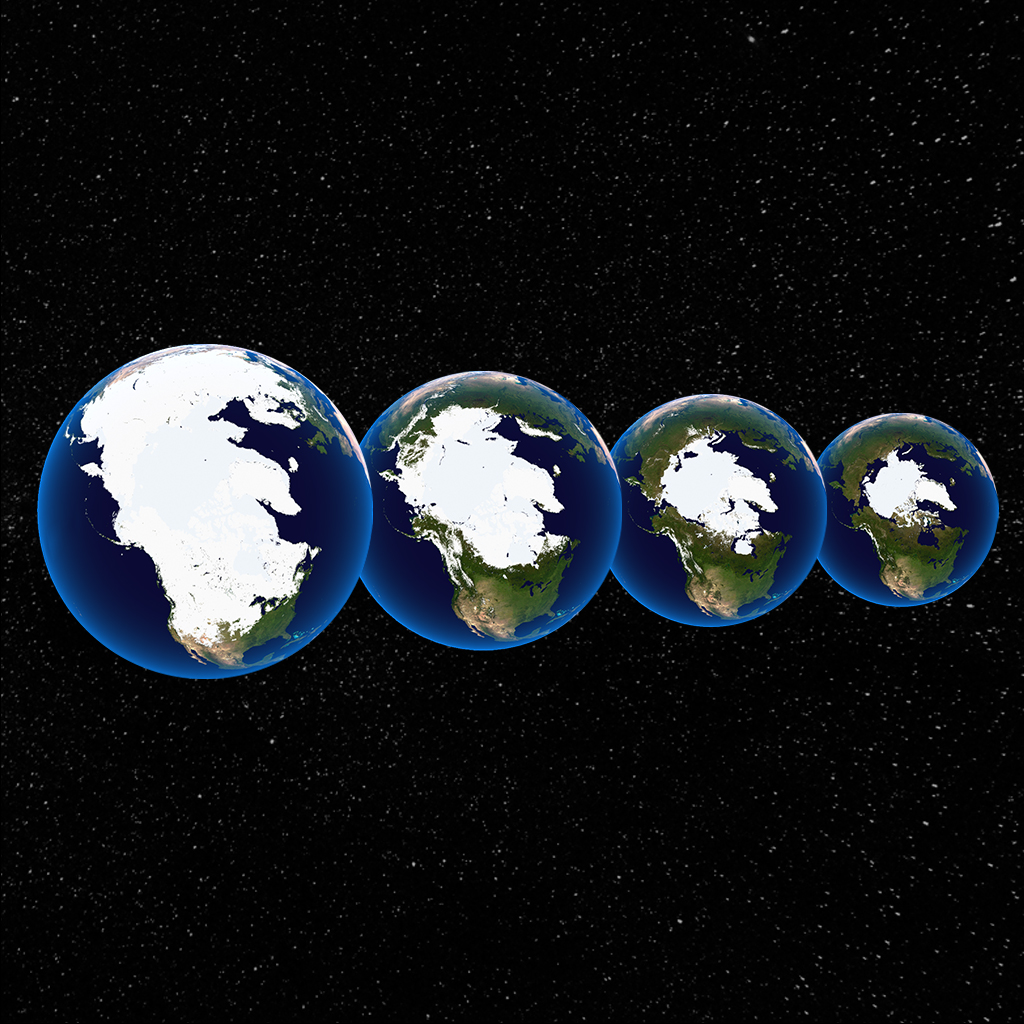
One of the most eye-opening moments comes with the Ice Data Timelapse. Students can watch ice coverage expand and retreat over time, revealing clear seasonal patterns. In the Northern Hemisphere, they observe ice reach its minimum extent around September and its maximum around March.
This long-term view helps students place January’s storm into context. Rather than seeing it as an isolated event, they recognize it as part of a broader seasonal cycle—while also opening the door to discussions about climate trends and variability.
Teachers can pause the timelapse to ask critical questions: How fast does ice coverage change? Are the patterns symmetrical year to year? What might influence these shifts?
Second graders learned about our planet in REAL TIME with #Hologlobe and @MergeVR! Such a cool experience - excited to dive deeper into the NASA and NOAA content! @EminenceSchools pic.twitter.com/xd48PVPko7
— Kendra Carr Waddell (@KendraWaddell) September 25, 2019
Connecting Experience to Evidence
What makes this learning experience especially meaningful is its immediacy. Students felt the cold. They saw the ice. Now they can investigate the science behind it using the same types of data real scientists rely on.
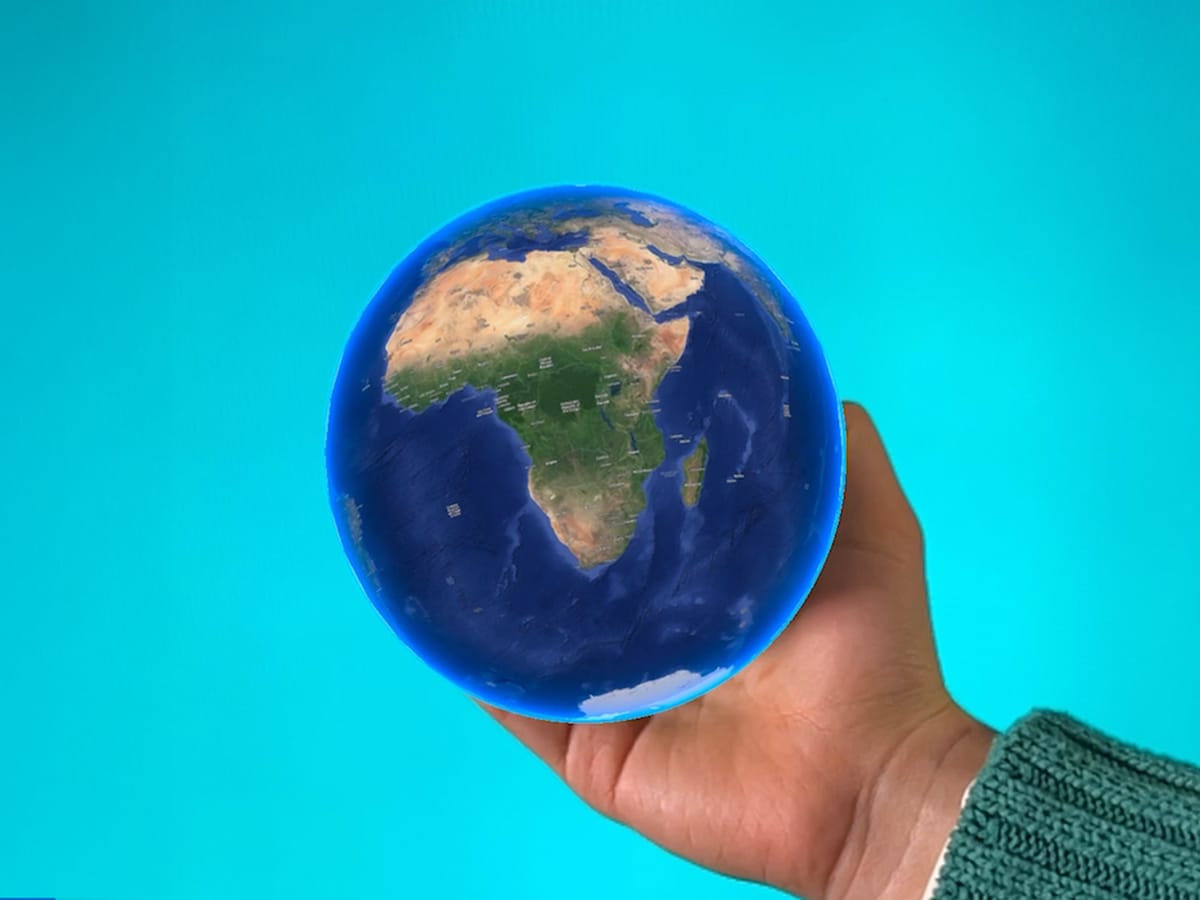
By holding the Earth in their hands with the Merge Cube, students move seamlessly between personal experience and global observation. This connection strengthens scientific thinking, encourages curiosity, and helps learners understand that Earth’s systems are dynamic, measurable, and deeply interconnected.
My #oesrams had a quick moment to explore the new @MergeVR app #hologlobe today.
— Heidi Samuelson #edtechcoach (@swampfrogfirst) April 21, 2022
We’ve been discussing how fire & precipitation can change the Earth’s surface quickly, so we looked at the data shared on the app#ARVRinEDU #AugmentedReality pic.twitter.com/6KTOJpINsC
Turning Weather into Wonder
Historic weather events don’t have to stay in the past once the ice melts. With Merge HoloGlobe, they become entry points for inquiry, data analysis, and systems thinking. Students learn not just what happened—but why it matters.
Explore Realtime Ice Data, Ice Data Timelapse, and other Earth system visualizations with Merge HoloGlobe and the Merge Cube, and help students connect the world outside their window to the planet as a whole. Try it for yourself today at trymerge.com.


