Enhancing Environmental Science Visualization with Merge Hologlobe and a Merge Cube
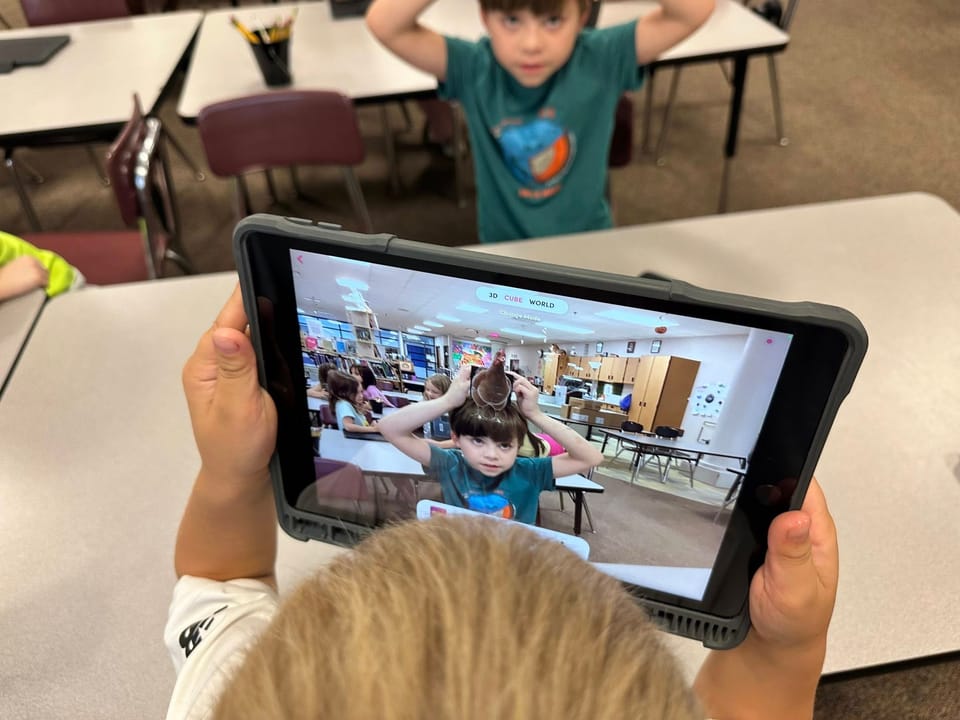
Incorporating Merge Hologlobe and a Merge Cube into science class provides students with engaging and visual tools that get them excited about learning about the world we live in.
It's important for students to understand global environmental phenomena, yet traditional methods of teaching these concepts can sometimes fall short in engaging students and providing real-time data. The Merge Hologlobe app, when used with a Merge Cube, provides students with an innovative way to track and study wildfires, cloud patterns, ice coverage and more in science class.
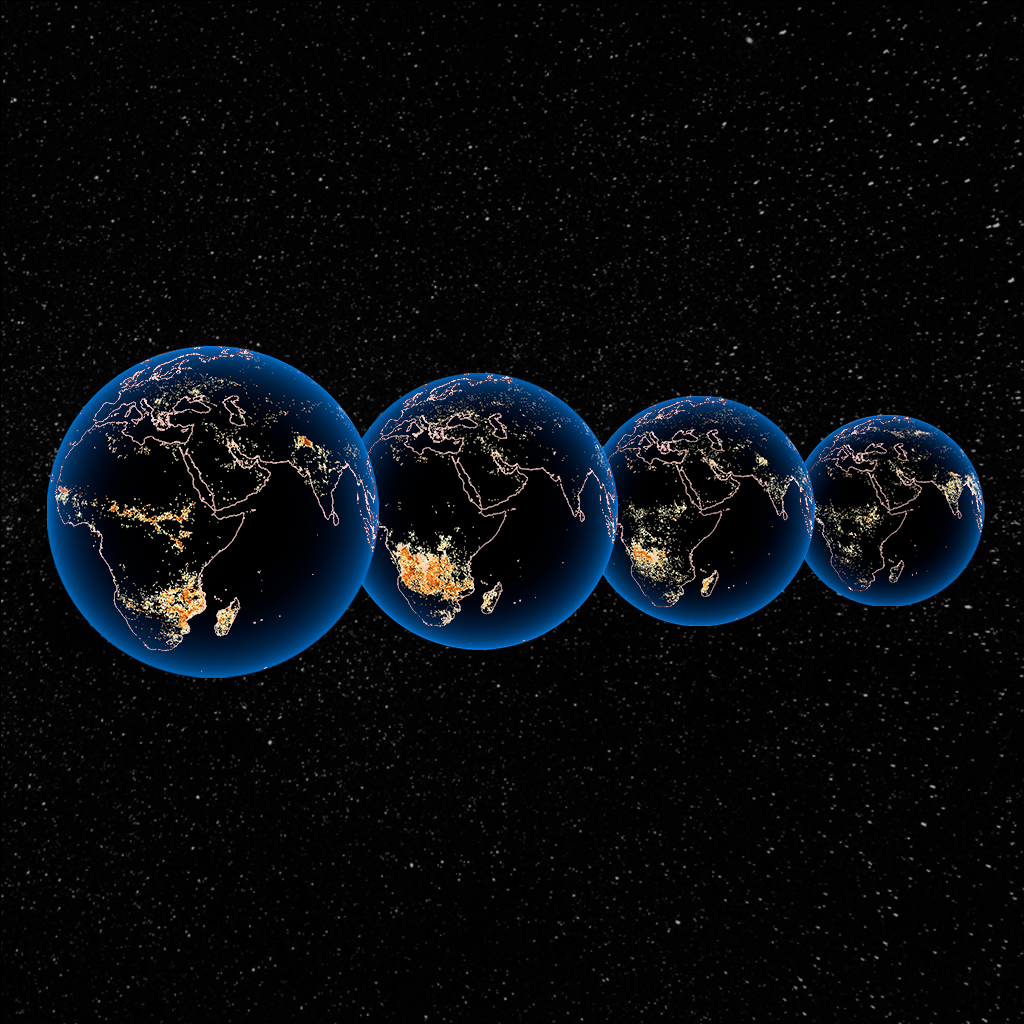
Tracking Wildfires
Wildfires are becoming increasingly prevalent. Using the Merge Hologlobe app, students can:
- Visualize active wildfires across the globe in real-time.
- Study the spread patterns of fires over days or weeks.
- Analyze the impact of weather conditions on fire behavior.
- Discuss the ecological and social implications of large-scale fires.
This hands-on approach allows students to grasp the scale and impact of wildfires much more visually than traditional 2D maps or textbook descriptions.
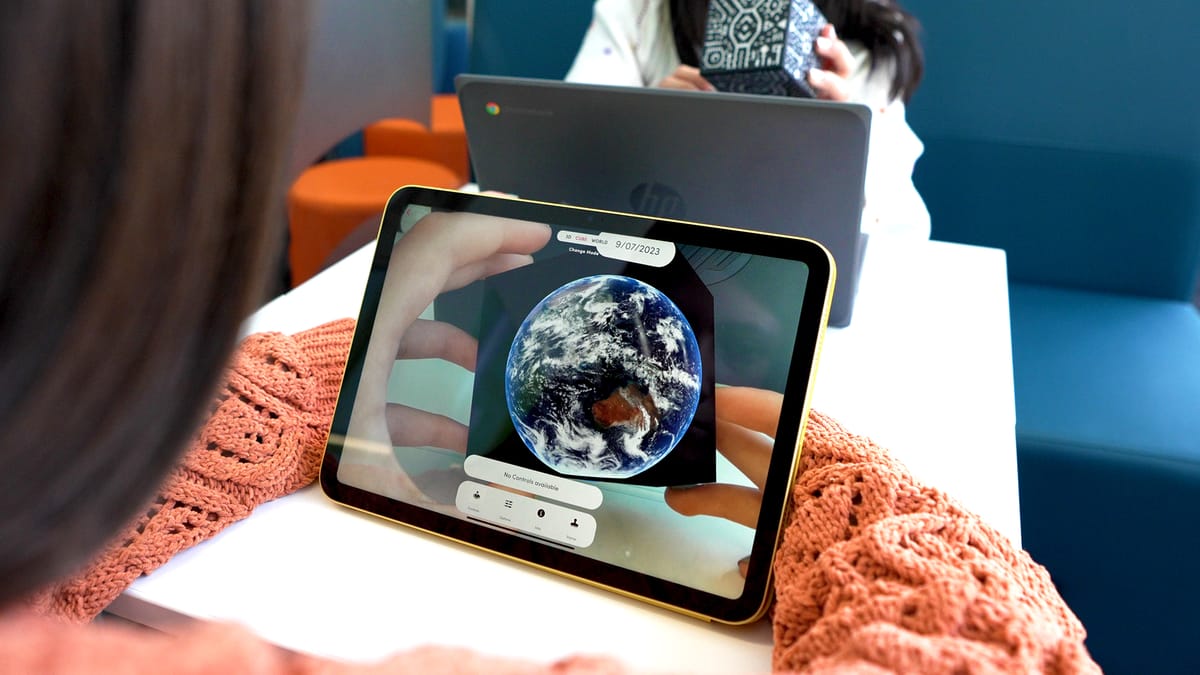
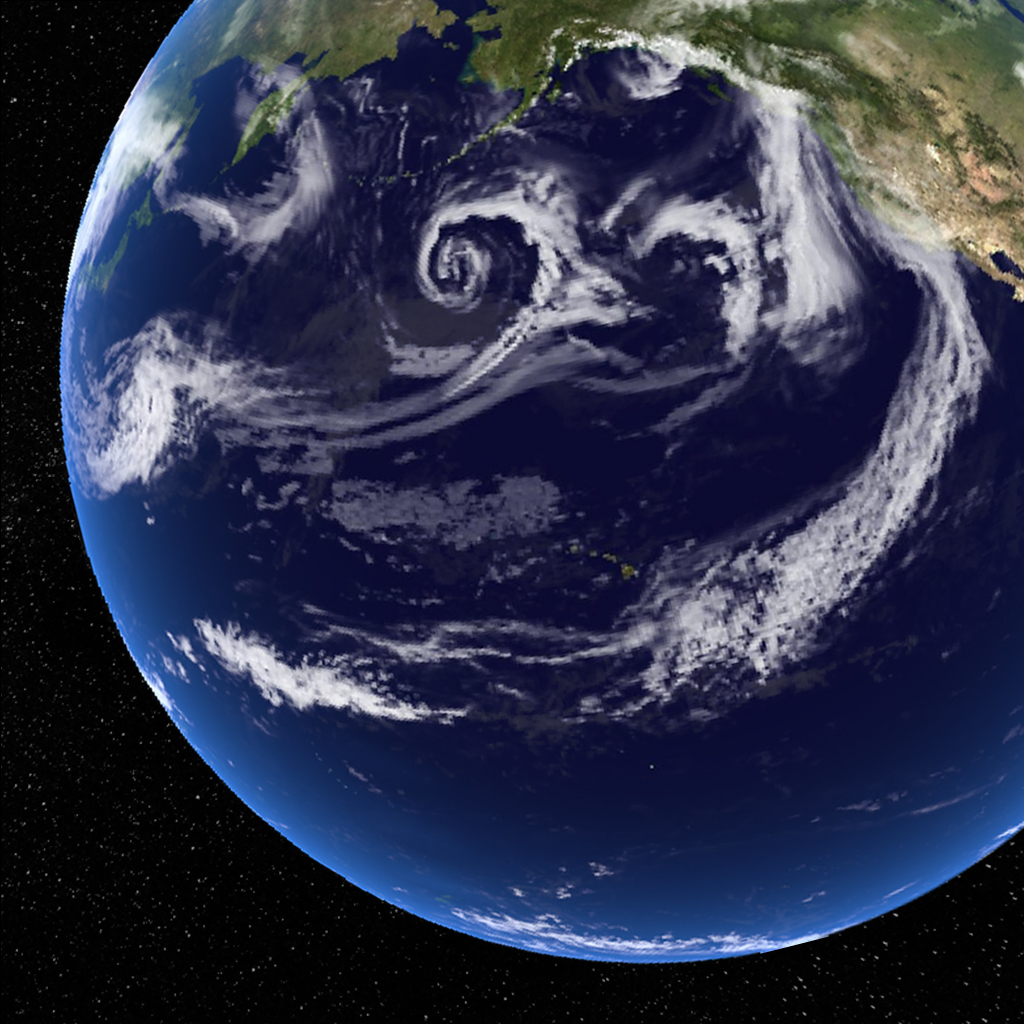
Observing Cloud Patterns
Understanding cloud formations and weather patterns is an important part of meteorology and climate science. With Merge Hologlobe, students can:
- View global cloud cover in real-time.
- Identify different types of cloud formations.
- Track the movement of storm systems across continents.
- Discuss how cloud patterns relate to climate and weather events.
This interactive method of studying clouds brings meteorology to life, making it more engaging and memorable for students.
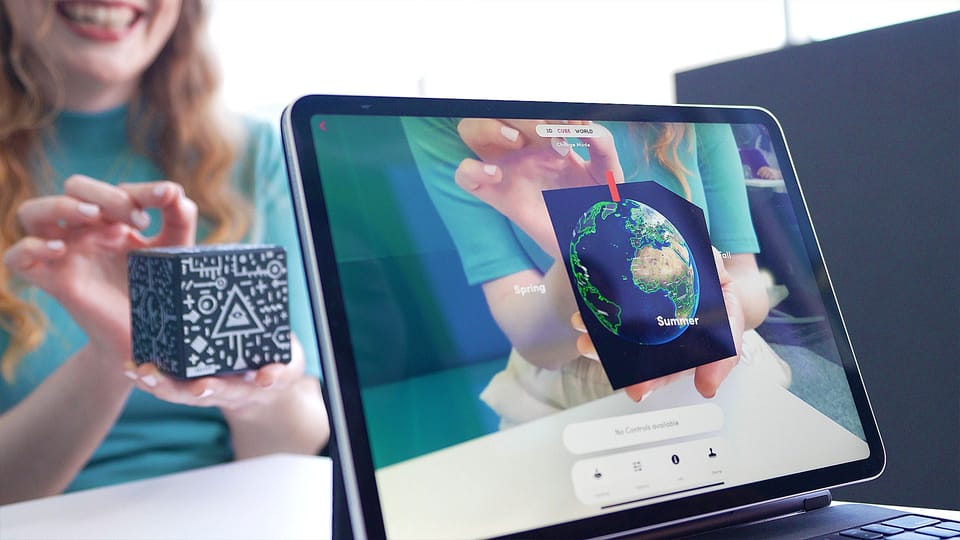
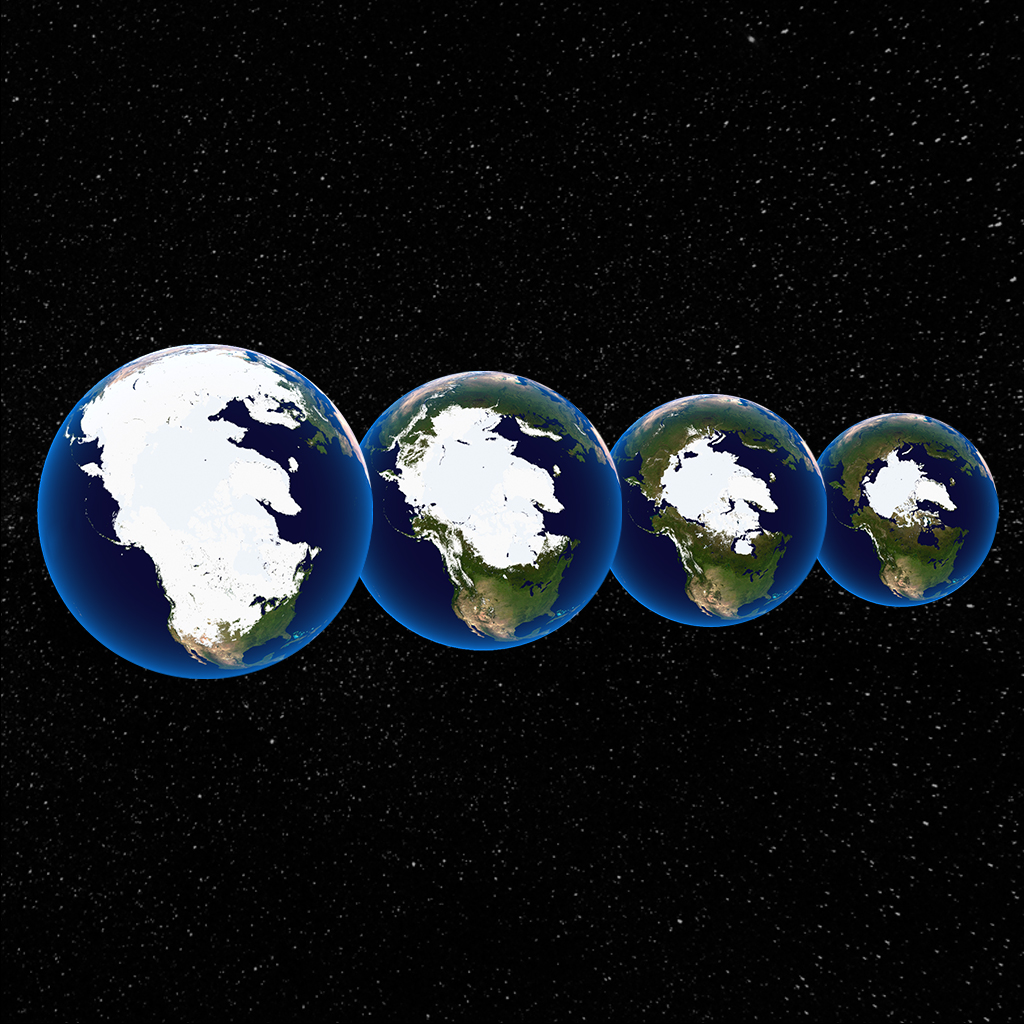
Monitoring Ice Coverage
Polar ice caps, glaciers, and ice coverage around the world changes over the course of a year. Using Merge Hologlobe, students can:
- Observe the current extent of polar ice caps and major glaciers.
- Compare ice coverage over different seasons throughout a calendar year.
- Discuss the implications of changing ice coverage on climate and ecosystems.
This visual representation helps students understand the changing nature of Earth’s ice and discuss how it affects weather and climate around the world.
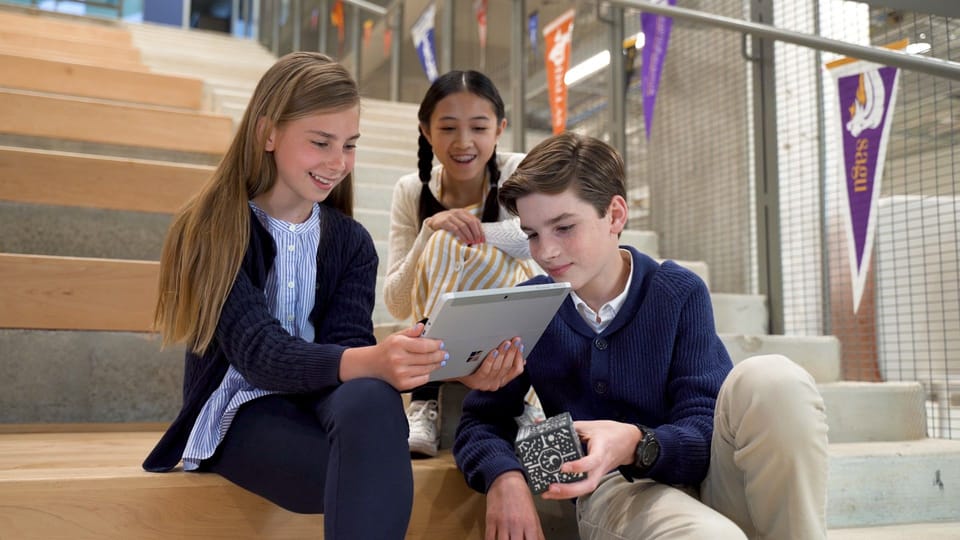
Benefits of Using AR in Environmental Science
By providing students with a hands-on way to explore global phenomena like wildfires, cloud patterns, and ice coverage, we can foster a deeper understanding of our planet's complex systems and challenges. Merge Hologlobe and a Merge Cube brings the whole world into the classroom in a way that will inspire the next generation of climatologists and meteorologists!