Celebrating World Oceans Day with Merge EDU
By visualizing data in 3D, learners can intuitively grasp the scale and complexity of the ocean’s role in Earth’s climate system.
June 8th is World Oceans Day! Officially set apart as a special day in 2008, World Ocean’s Day was created to promote conservation and recognize the vast, life-sustaining power of our planet’s largest bodies of water. Covering more than 70% of Earth’s surface, oceans regulate climate, provide food and oxygen, and are home to millions of species—many of which remain unexplored.
🐠 Explore the Ocean—From Anywhere
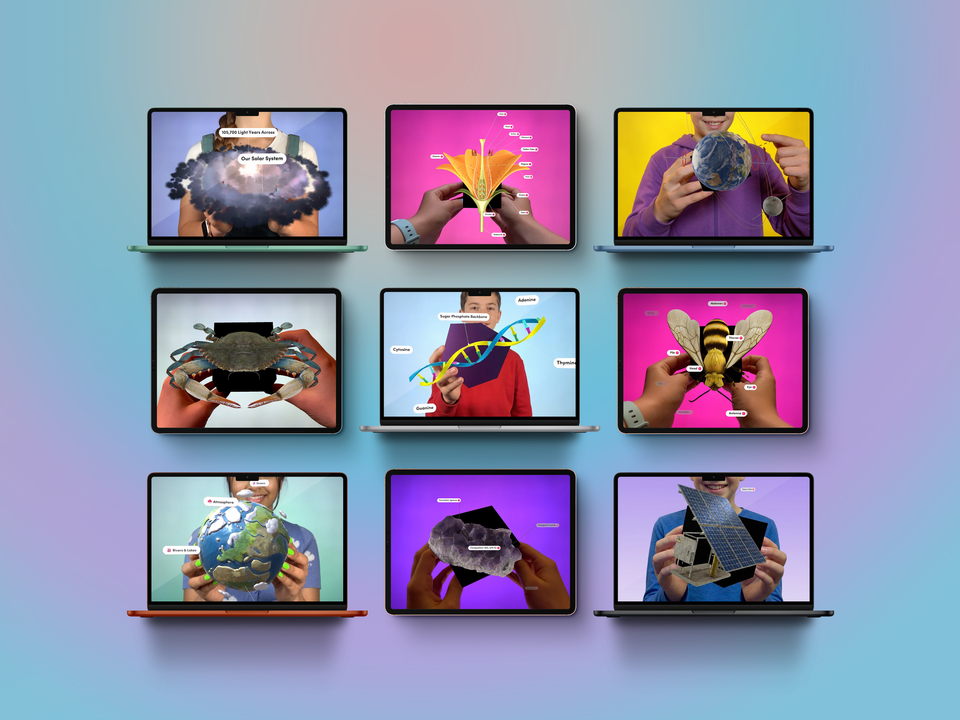
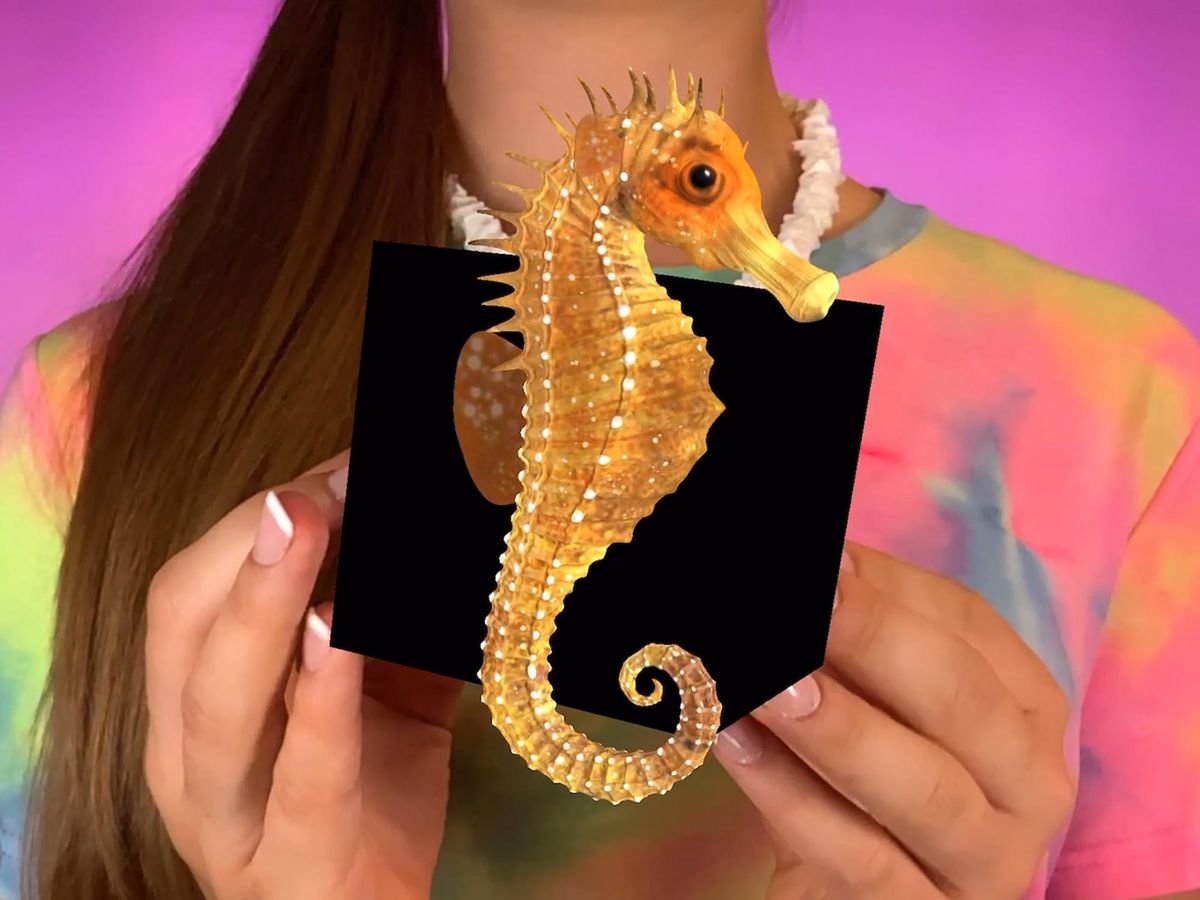
With Merge Explorer, students can investigate digital 3D models of marine creatures, coral reefs, and entire underwater ecosystems in the palm of their hand. They can observe the anatomy of a great white shark, examine a sea turtle up close, hold a jellyfish and discover how it swims, and more!
- Explore this collection of creatures in the Ocean Deep Collection!
- Explore various marine animals and plants in the Sea Life Collection!
- Dive underwater with a shark and explore its anatomy in this simulation!
- Explore where water is found on Earth with this simulation!
These detailed simulations are designed to spark wonder and curiosity, making ocean science approachable and memorable.
🌀 Understanding Earth’s Blue Engine
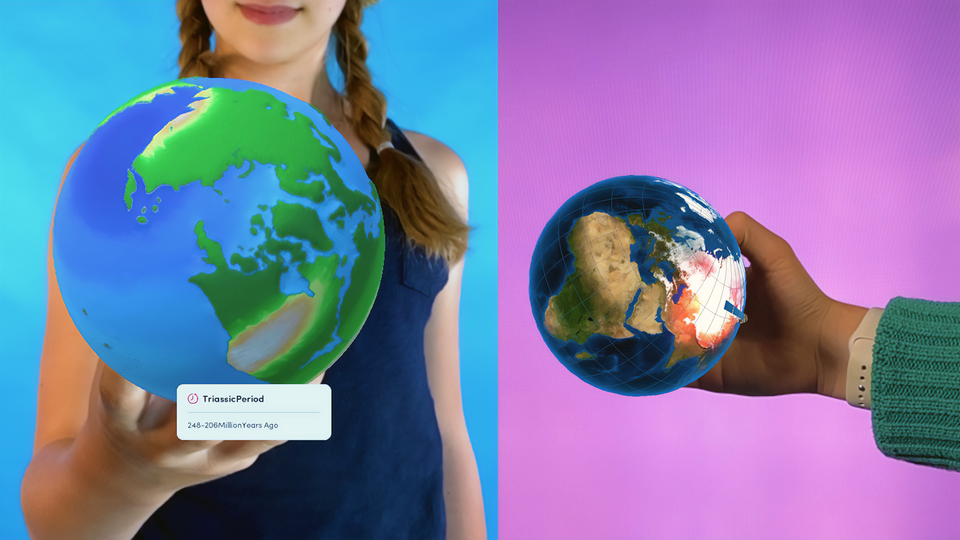
The ocean is Earth’s most powerful force of stability and change. With Merge HoloGlobe, students can visualize real satellite data from NASA and NOAA that shows ocean temperatures, current systems, and even storm formations.


By visualizing data in 3D, learners can intuitively grasp the scale and complexity of the ocean’s role in Earth’s climate system.
🌐 Digital Learning with Real-World Purpose
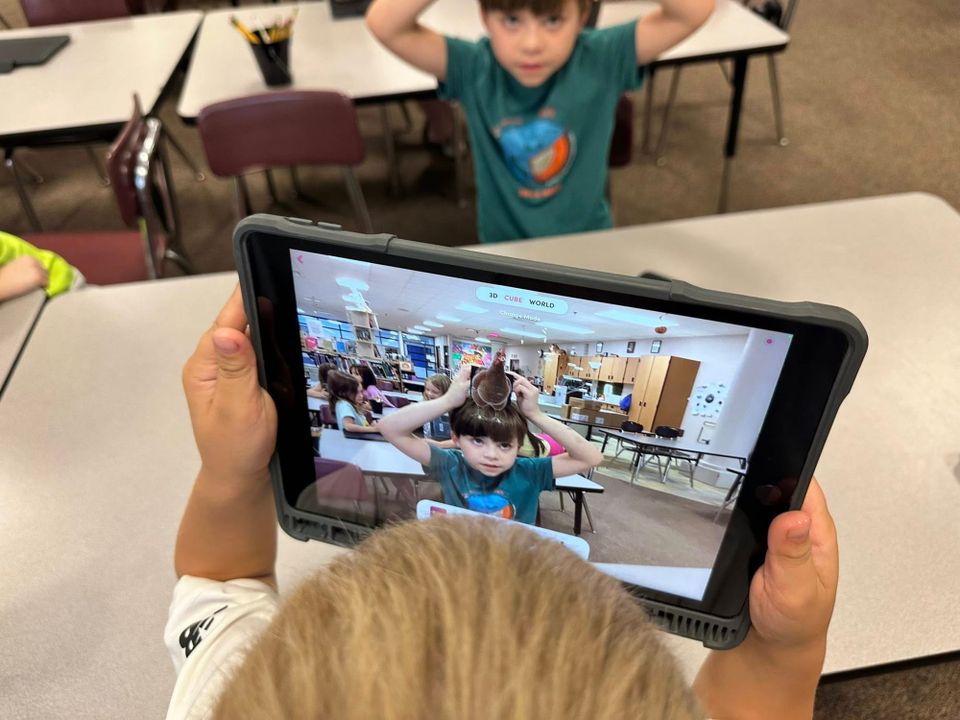
Merge EDU can transform abstract environmental topics into tactile, multisensory moments of discovery. In celebrating World Oceans Day, we’re reminded that the future of our oceans lies in the hands of today’s students. By giving them the tools to explore, question, and understand, we help them become the ocean stewards our world needs.
👉 Dive into Merge EDU and get a free trial at trymerge.com